
Calculate your actual network throughput (goodput) from a given link speed after accounting for protocol overhead, TCP/IP headers, Ethernet framing, and other real-world factors. All calculations run locally in your browser.
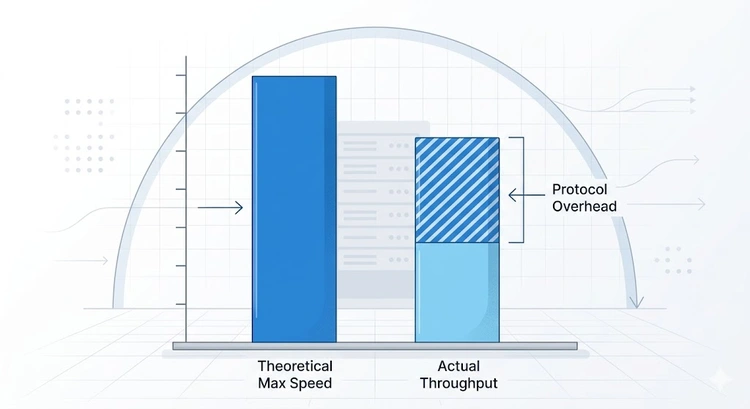
Network throughput is the actual rate of data transfer over a network link, as opposed to the theoretical maximum (link speed or bandwidth). The gap between advertised speed and real-world performance is caused by protocol overhead — the headers, framing, and control information that every packet must carry alongside your actual data.
This calculator helps you understand exactly where your bandwidth goes. If your speed test shows lower numbers than your ISP plan, overhead is a major factor. For converting between bandwidth units, use our Bandwidth Calculator.
These three terms are often used interchangeably but mean different things. Understanding the distinction is critical for capacity planning and troubleshooting:
| Term | Definition | Includes Overhead? | Example (1 Gbps link) |
|---|---|---|---|
| Bandwidth | Maximum theoretical capacity of the link | N/A — it's the pipe size | 1,000 Mbps |
| Throughput | Actual data rate including all headers | Yes — counts all bits on wire | ~960 Mbps (utilization limit) |
| Goodput | Application-level data rate (payload only) | No — pure user data | ~940 Mbps (after overhead) |
When you run a speed test, the result is typically throughput (including TCP/IP headers) but not including Ethernet framing. Your actual file transfer rate (goodput) will be slightly lower. The File Transfer Calculator uses goodput to estimate real transfer times.
Pro Tip: On a standard 1 Gbps Ethernet link with TCP, the maximum achievable goodput is approximately 941 Mbps — about 94.1% of the link speed. The remaining 5.9% goes to Ethernet framing (preamble, headers, FCS, interframe gap), IP headers, and TCP headers. If your speed test shows 940+ Mbps, your connection is performing at maximum efficiency. Anything significantly below that points to other bottlenecks — check with our Network Latency Test.
Every packet on an Ethernet network carries multiple layers of headers. Here's the overhead breakdown for a typical TCP packet on standard Ethernet (1500 MTU):
| Component | Size (bytes) | % of 1538B frame | Purpose |
|---|---|---|---|
| Preamble + SFD | 8 | 0.52% | Clock synchronization |
| Ethernet header | 14 | 0.91% | MAC addresses, EtherType |
| IPv4 header | 20 | 1.30% | Source/destination IP, TTL |
| TCP header | 20 | 1.30% | Ports, sequence, flags |
| FCS (CRC-32) | 4 | 0.26% | Error detection |
| Interframe gap | 12 | 0.78% | Minimum gap between frames |
| Total overhead | 78 | 5.07% | |
| Payload (goodput) | 1460 | 94.93% | Your actual data |
For a detailed per-packet view, use our Packet Size Calculator to see exactly how headers stack up for your specific configuration.
While overhead percentage stays roughly constant, its absolute impact grows with link speed. Here's what you actually get at each common link speed with standard TCP/Ethernet overhead:
| Link Speed | Overhead (~5.9%) | Max Goodput | Max Data Rate |
|---|---|---|---|
| 100 Mbps (Fast Ethernet) | 5.9 Mbps | 94.1 Mbps | 11.8 MB/s |
| 1 Gbps (Gigabit) | 59 Mbps | 941 Mbps | 117.6 MB/s |
| 2.5 Gbps (Multi-Gig) | 148 Mbps | 2,352 Mbps | 294 MB/s |
| 5 Gbps (Multi-Gig) | 295 Mbps | 4,705 Mbps | 588 MB/s |
| 10 Gbps | 590 Mbps | 9,410 Mbps | 1,176 MB/s |
| 25 Gbps | 1,475 Mbps | 23,525 Mbps | 2,941 MB/s |
| 100 Gbps | 5,900 Mbps | 94,100 Mbps | 11,763 MB/s |
Compare these theoretical maximums against your actual results from the Speed Test. If there's a significant gap, protocol overhead isn't the cause — look into latency, congestion, or hardware bottlenecks.
VPN connections add significant overhead because they encapsulate your packets inside additional headers and encryption. This is one of the biggest practical sources of reduced throughput:
If you suspect your VPN is slowing you down, run our Speed Test both with and without the VPN active. Check if your ISP is throttling VPN traffic specifically. The Network Latency Test can reveal if the VPN is adding latency beyond just overhead.
For long-distance or high-latency connections, TCP window size becomes the throughput bottleneck rather than overhead. The maximum throughput of a single TCP connection is:
Max Throughput = TCP Window Size / Round-Trip Time (RTT)For example, with a default 64 KB window and 100ms RTT: 64 KB / 0.1s = 640 KB/s = 5.12 Mbps. This is why a 1 Gbps connection to a distant server might only achieve a fraction of its capacity per connection. Modern TCP uses window scaling (up to 1 GB) and multiple concurrent connections to overcome this.
Measure your RTT with the Ping Test and latency characteristics with the Network Latency Test. For bandwidth unit conversions, use the Bandwidth Calculator.
WiFi has significantly more overhead than wired Ethernet due to wireless-specific mechanisms:
Real-world WiFi throughput is typically 50-70% of the PHY rate. A WiFi 6 connection at 1200 Mbps PHY rate delivers ~600-840 Mbps of actual goodput. Test your WiFi performance with our Speed Test and follow our WiFi speed testing guide for optimization tips. Check signal quality with the Signal Strength Converter.
Several factors contribute: protocol overhead (5-6%), WiFi overhead (30-50% on wireless), network congestion, server distance and latency, router processing limits, and ISP throttling. Run the speed test wired directly to your modem to isolate WiFi from ISP issues. Check for throttling with our ISP throttling test.
With standard 1500-byte MTU and TCP, the maximum goodput is approximately 941 Mbps (94.1% efficiency). With jumbo frames at 9000 bytes, it increases to about 989 Mbps (98.9%). These figures assume a single direction — full-duplex Gigabit Ethernet can achieve this in both directions simultaneously.
Yes, a VPN always adds some overhead (3-7% from encapsulation headers plus encryption CPU cost). However, on modern hardware with fast VPN protocols like WireGuard, the reduction is typically under 10%. In some cases, a VPN can actually improve speed if your ISP throttles specific traffic types and the VPN prevents detection.
Mbps (megabits per second) measures network speed in bits. MB/s (megabytes per second) measures data rate in bytes. Since 1 byte = 8 bits, divide Mbps by 8 to get MB/s. A 100 Mbps connection transfers about 12.5 MB/s. Use our Bandwidth Calculator for precise conversions between all bandwidth units.
Latency limits TCP throughput through the bandwidth-delay product. A single TCP connection can transfer at most: Window Size / RTT. With default 64 KB window and 100ms RTT, max throughput is only 5.12 Mbps — regardless of link speed. Window scaling and parallel connections mitigate this. Measure your latency with the Network Latency Test.
No. Jumbo frames (9000 MTU) are designed for data center networks where all devices support them. Home routers, ISP equipment, and most internet servers use standard 1500-byte MTU. Enabling jumbo frames on your home network will cause fragmentation and likely reduce performance. Stick with the default MTU.
WiFi has three major sources of overhead that wired connections lack: the shared medium requires contention protocols (CSMA/CA), wireless frames have larger headers with per-frame ACKs, and interference causes retransmissions. A WiFi 6 link at 1200 Mbps PHY rate typically delivers 600-840 Mbps of actual goodput. For maximum speed, use wired Ethernet — see our Cat5e vs Cat6 comparison.

About Tommy N.
Tommy is the founder of RouterHax and a network engineer with 10+ years of experience in home and enterprise networking. He specializes in router configuration, WiFi optimization, and network security. When not writing guides, he's testing the latest mesh WiFi systems and helping readers troubleshoot their home networks.
 |
 |
 |
 |
Promotion for FREE Gifts. Moreover, Free Items here. Disable Ad Blocker to get them all.
Once done, hit any button as below
|
|
|
|