
WiFi signal strength is measured in dBm — a logarithmic unit that most apps display as a negative number between 0 and -110. But what does -67 dBm actually mean for your Netflix stream or online game? This free signal strength converter translates any dBm value into a quality percentage, a plain-English description, a visual signal bar display, and a list of what that signal level supports. If you've ever wondered why your connection feels slow despite having "good" bars, understanding actual dBm values is the key. You can also run a speed test after checking your signal to see the real-world impact.
WiFi signal strength is a measurement of the radio power level received by your device from a wireless access point or router. It quantifies how strong the radio waves are at your device's location after traveling through walls, furniture, floors, and air. A stronger signal means more reliable data transmission with fewer errors and retransmissions, which translates directly to faster speeds and lower latency.
Signal strength is affected by distance from the router, physical obstacles (walls, floors, and metal surfaces absorb or reflect radio waves), interference from other WiFi networks and wireless devices, and the frequency band in use. The 2.4 GHz band travels farther through obstacles but is more congested; the 5 GHz band offers higher speeds but shorter range. Understanding this helps when you're deciding where to place your router or whether to check who is on your WiFi and whether crowded channels are hurting your signal.
Most operating systems, network scanning apps, and router admin interfaces report signal strength in dBm. Windows reports RSSI (which maps to dBm). Android apps like WiFi Analyzer show raw dBm readings. Your router's admin page — accessible via your router's IP address — usually shows connected client signal levels in dBm as well.
dBm stands for decibel-milliwatts — a unit of power measured relative to 1 milliwatt. The "dB" part means it's logarithmic: every 3 dB change represents roughly double or half the signal power. This is critically important for interpreting WiFi readings:
| dBm Difference | Power Ratio | Practical Impact |
|---|---|---|
| 3 dB | 2× power | Noticeable improvement in marginal conditions |
| 10 dB | 10× power | Significant quality jump, one full "bar" level |
| 20 dB | 100× power | Dramatic difference — like moving from another room to standing next to the router |
| 30 dB | 1000× power | Exceptional vs. completely unusable signal |
This logarithmic nature means that moving from -80 dBm to -70 dBm is a 10× improvement in power — not just a "10 point" improvement. It also explains why bar displays on phones can be misleading: the bars use a linear visual scale to represent a logarithmic measurement. A phone showing 3 bars may have a signal barely better than 2 bars in actual power terms.
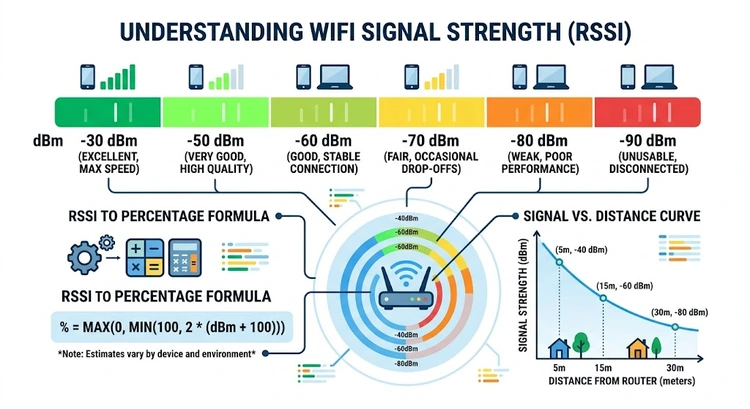
Because dBm values for received signal are always negative (you're receiving less than 1 milliwatt), stronger signals are less negative. -30 dBm is an extremely strong signal; -90 dBm is nearly unusable. This confuses many users who assume larger numbers mean stronger signal.
Here is the definitive reference for what each dBm range means in practice for a modern 802.11ac/WiFi 5 or 802.11ax/WiFi 6 network. For additional context, industry tools from MetaGeek Wi-Spy use similar threshold ranges for professional WiFi analysis.
| dBm Range | Quality | Bars | Use Cases Supported |
|---|---|---|---|
| -30 to -50 dBm | Exceptional | 5/5 | Maximum performance: 4K/8K streaming, VR gaming, video conferencing, everything |
| -50 to -60 dBm | Excellent | 4–5/5 | 4K streaming, competitive online gaming, multiple video calls simultaneously |
| -60 to -67 dBm | Very Good | 3–4/5 | HD/1080p streaming, fast downloads, VoIP calls, most enterprise applications |
| -67 to -70 dBm | Good | 3/5 | Minimum recommended for HD video; reliable for most tasks. -67 dBm is the commonly cited enterprise minimum. |
| -70 to -80 dBm | Fair | 2/5 | Basic web browsing, email, SD video streaming; may struggle with video calls |
| -80 to -90 dBm | Weak | 1/5 | Occasional disconnects, very slow speeds; unreliable for most tasks |
| Below -90 dBm | No Signal | 0/5 | Effectively unusable; device may show connected but nothing loads |
The -67 dBm threshold is particularly important. It's the minimum signal strength recommended by Cisco and most enterprise WiFi vendors for VoIP and video applications. If your signal is worse than -67 dBm, you're likely to experience degraded call quality and video buffering even if your device shows "full bars."
For home networks, most users notice problems when signal drops below -70 dBm. At -75 dBm, speeds are typically reduced by 50% or more compared to the same connection at -65 dBm, even with no change in network congestion. If your speed test results are poor, check your device's dBm reading first.
You'll often see the term RSSI (Received Signal Strength Indicator) used alongside or instead of dBm. They're related but not identical:
| Property | dBm | RSSI |
|---|---|---|
| Full name | Decibel-milliwatts | Received Signal Strength Indicator |
| Unit type | Absolute (physics-based) | Relative (vendor-defined) |
| Typical range | -30 to -110 dBm | 0–255 or 0–100 (varies by vendor) |
| Standardized? | Yes — universal unit | No — each chipset vendor defines its own scale |
| Negative values? | Yes (always negative for received WiFi) | No (usually 0 = worst, max = best) |
| Used by | Network analyzers, router admin UIs | Windows WiFi API, some Android apps |
Windows reports WiFi quality as a percentage (0–100%) derived from RSSI. The Windows formula maps -100 dBm to 0% and -50 dBm to 100%, with linear interpolation between those points. This means Windows shows 100% signal at anything better than -50 dBm — which is why your laptop may show "Excellent" signal at -55 dBm while actually being at 90% of maximum quality.
On Android, signal strength is reported as RSSI in dBm directly by the WiFi subsystem. Third-party apps like WiFi Analyzer display this raw dBm value. On iOS, there's no official API for dBm readings in consumer apps, though network diagnostic profiles can expose it.
Many factors influence the dBm reading your device reports. Understanding them helps you diagnose problems and make targeted improvements rather than just "moving closer to the router."
If you're on a congested network and want to reduce interference, consider enabling MAC address filtering or blocking unwanted WiFi users to ensure your bandwidth isn't being shared unnecessarily.
Once you know your dBm value, you can take targeted steps to improve it. Here are the most effective methods, roughly in order of impact:
If you've made improvements, re-run the speed test and compare your dBm before and after to quantify the improvement. You can also use the network latency test tool to check if your ping has improved.
Pro Tip: The -67 dBm threshold is the industry standard for reliable enterprise WiFi. If your signal is worse than -67 dBm and you're experiencing issues, no amount of software tweaking will fully compensate — you need a hardware solution like repositioning your router, adding a mesh node, or running a cable. Don't waste time adjusting DNS settings or QoS rules when the root cause is a weak signal.
Key Takeaways
dBm (decibel-milliwatts) is an absolute unit of radio power measured relative to 1 milliwatt on a logarithmic scale. For WiFi received signal, dBm values are always negative — -30 dBm is a very strong signal while -90 dBm is nearly unusable. Every 10 dBm difference represents a 10× change in actual signal power. It's the most accurate way to measure and compare WiFi signal strength across different devices and networks.
For general use, -70 dBm or better is considered acceptable for home WiFi. For HD streaming and video calls, aim for -67 dBm or better. For competitive gaming and 4K streaming, -60 dBm or better is recommended. The enterprise standard for voice and video applications is -67 dBm minimum. Anything worse than -80 dBm will cause noticeable performance problems including slow speeds and disconnections.
Signal strength (dBm) measures radio power but not data throughput. A -70 dBm signal is marginal but functional. Slow speeds at that signal level can be caused by: co-channel interference from neighboring WiFi networks, network congestion from many devices sharing your router, ISP throttling or slow internet connection, outdated WiFi standards (802.11n vs. 802.11ac), or a congested WiFi channel. Run a speed test and compare results on both 2.4 GHz and 5 GHz bands.
RSSI (Received Signal Strength Indicator) is a relative measure of signal strength defined differently by each hardware vendor. Unlike dBm which is a standardized absolute unit, RSSI scales vary — some vendors use 0–255, others 0–100. Windows converts its internal RSSI to a 0–100% quality score for display. Most professional network tools use dBm because it's standardized and directly comparable across devices.
On Android, go to Settings → About Phone → Status → WiFi signal strength. Alternatively, use a free app like WiFi Analyzer which shows real-time dBm for all nearby networks. On iPhone, there's no native dBm display in consumer iOS, but you can enable it via a developer profile or use third-party network diagnostic tools. Your router's admin page also typically shows the dBm of connected clients.
In open air, a typical home router can reach 30–50 meters on 5 GHz and 50–100 meters on 2.4 GHz before signal drops below -75 dBm. In a typical house with walls, usable 5 GHz range is often 15–25 meters, and 2.4 GHz 25–50 meters. These are approximations — building materials, router power, and antenna design all affect actual range significantly. A concrete-reinforced floor can reduce 5 GHz signal by 15–20 dBm on its own.
Yes, 5 GHz signals attenuate more than 2.4 GHz signals through the same obstacles. The higher frequency means shorter wavelength, which is absorbed more by walls, floors, and furniture. In open space, 5 GHz signals also decay faster with distance. However, 5 GHz offers much higher maximum speeds (due to wider channel widths and less congestion) and lower latency. For devices close to the router, 5 GHz is almost always the better choice despite its shorter range.
 |
 |
 |
 |

About Tommy N.
Tommy is the founder of RouterHax and a network engineer with 10+ years of experience in home and enterprise networking. He specializes in router configuration, WiFi optimization, and network security. When not writing guides, he's testing the latest mesh WiFi systems and helping readers troubleshoot their home networks.
Promotion for FREE Gifts. Moreover, Free Items here. Disable Ad Blocker to get them all.
Once done, hit any button as below
|
|
|
|