by Tommy N. Updated Apr 23, 2026
If your WiFi feels sluggish in certain rooms, the culprit is almost always signal strength — and understanding dBm values gives you the power to diagnose and fix the problem yourself. WiFi signal strength is measured in decibel-milliwatts (dBm), a logarithmic scale that tells you exactly how strong (or weak) your wireless signal really is.

In this guide you will learn exactly what dBm numbers mean, how to check signal strength on any device, and what steps to take when your readings fall into the danger zone. Whether you are troubleshooting dead spots or just curious why streaming stutters in the bedroom, understanding these values pairs perfectly with our slow WiFi troubleshooting guide and our advice on how to change your WiFi channel for a cleaner signal.

dBm stands for decibels relative to one milliwatt. It is a unit of absolute power used in radio frequency (RF) engineering to express signal levels in a way that stays meaningful across an enormous range of values. Because wireless signals decay exponentially with distance, engineers use a logarithmic scale — every 3 dBm change represents roughly double or half the actual power. That means −60 dBm is not twice as strong as −70 dBm; it is actually about eight times stronger in raw power terms.
WiFi signal strength values are always negative numbers. A value closer to zero is stronger, while a value further from zero (more negative) is weaker. The theoretical maximum you will ever see on a home network is around −10 dBm, though real-world readings at arm’s length from a router typically land between −30 dBm and −50 dBm. Most devices stop associating reliably below −80 dBm, and below −90 dBm the signal is considered unusable.
The reason this scale matters for everyday users is simple: your device’s WiFi adapter is constantly measuring received signal strength indicator (RSSI), which is directly tied to dBm. When the signal drops below a usable threshold, your device either disconnects, falls back to a slower modulation scheme, or reduces its data rate to compensate — all of which translate into the sluggishness you feel while browsing or streaming. Understanding the numbers lets you make informed decisions about router placement, antennas, and whether you need a mesh system or a simple channel change.
It is also important to understand signal-to-noise ratio (SNR). Even a −65 dBm signal can perform poorly if background noise in your environment sits at −70 dBm, giving you only 5 dBm of headroom. A healthy SNR is generally 25 dBm or more. This is why two homes with identical router models can have wildly different experiences: one sits in a quiet RF environment while the other is surrounded by a dozen competing networks and microwave ovens all generating interference.
Follow these steps to get an accurate dBm reading on any common device or platform.
netsh wlan show interfaces then press Enter. Look for the “Signal” percentage and the “Receive rate” line. For the raw dBm value, third-party tools like WiFi Analyzer (available in the Microsoft Store) display it directly on a live graph.*3001#12345#* in the Phone app to open Field Test Mode. Navigate to the serving cell data to find RSSI. Note that on iOS this works best for cellular; for WiFi dBm on iPhone, a third-party app such as Network Analyzer is the most practical solution.Use this table to instantly interpret any dBm reading you find on your device and understand what real-world performance to expect.
| dBm Range | Signal Quality | Typical Use Case | Expected Throughput |
|---|---|---|---|
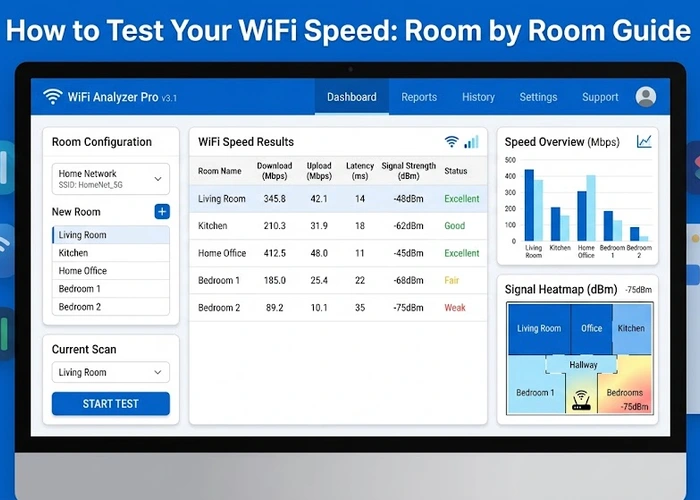
| −30 to −50 dBm | Excellent | Within the same room as the router | Full rated speed, 4K streaming & gaming without issue |
| −50 to −60 dBm | Good | 1–2 rooms away, light walls | HD video, video calls, large downloads all reliable |
| −60 to −70 dBm | Fair | Several rooms away or through one concrete wall | Web browsing & SD video fine; HD may buffer occasionally |
| −70 to −80 dBm | Weak | Edge of router range, multi-story homes | Basic browsing possible; drops & latency spikes common |
| Below −80 dBm | Unusable | Dead zones, thick concrete, long distances | Frequent disconnects; most modern protocols will not associate |
Network engineers commonly target −67 dBm as the minimum acceptable signal for reliable VoIP calls, video conferencing, and streaming. If your survey shows readings weaker than −67 dBm in areas where you regularly work or watch video, that room is a prime candidate for a range extender, powerline adapter, or a mesh satellite node — not just a router reboot.
Once you have identified weak spots using a signal survey, there are several practical steps you can take before spending money on new hardware. The most impactful changes are almost always physical: router placement, obstructions, and interference sources. If you have already optimized placement and still see poor readings, the next layer involves your router’s configuration — particularly the wireless channel. Overlapping channels from neighboring networks are one of the most underestimated causes of effective signal degradation, and our WiFi channel guide walks through exactly how to identify and switch to a cleaner channel.
Beyond placement and channel selection, router firmware plays a surprisingly large role. Manufacturers regularly push updates that improve RF transmit power calibration, beamforming algorithms, and roaming behavior. An outdated firmware can mean your router is not using its full legal transmit power budget or is making poor antenna decisions. Check our guide to update your router firmware to make sure you are running the latest build before assuming you need new hardware.
Here are the most effective actions you can take to improve dBm readings throughout your home:
Pro Tip: Before buying a range extender, run a free channel scan with our WiFi Channel Finder tool to confirm whether interference is the real culprit — switching from channel 6 to channel 1 or 11 on 2.4 GHz can sometimes recover 10–15 dBm of effective signal quality without spending a cent.
A reading between −30 dBm and −67 dBm is considered good for home networking. Values closer to −30 dBm indicate an excellent, near-router connection, while −67 dBm is the widely accepted minimum for reliable video streaming and VoIP. Anything weaker than −70 dBm will likely produce noticeable drops in speed and stability. You can improve weak readings by optimizing router placement or following our slow WiFi guide for a full diagnostic checklist.
Because dBm is measured relative to one milliwatt of power, and WiFi received signals are always far below that reference level. A received signal might be measured in picowatts or nanowatts, which translates to values like −70 or −80 on the logarithmic scale. The closer to zero (less negative) the number, the stronger the actual power level being received by your device.
RSSI (Received Signal Strength Indicator) is a relative, vendor-defined index that different chipmakers scale differently — one manufacturer might use 0–100, another 0–255. dBm is an absolute, standardized unit of power. Most modern operating systems and network analysis tools convert RSSI internally and report dBm because it is directly comparable across devices and manufacturers.
Signal attenuation through building materials varies considerably. A standard drywall interior partition typically costs 3–5 dBm, while a concrete or brick exterior wall can cost 10–15 dBm or more per wall. Metal surfaces, elevator shafts, and large fish tanks can reduce signal by 20–30 dBm. This is why a router that shows −45 dBm in the same room might only show −75 dBm after passing through two concrete floors in a multi-story home.
Increasing your router’s transmit power can marginally improve coverage, but it is rarely the silver bullet users hope for. The link between your router and your device is bidirectional — if your device’s antenna can only transmit at 15 dBm, a router blasting at 30 dBm still cannot force the device to respond at higher power. Antenna gain, router placement, and channel selection typically deliver more real-world improvement than simply cranking transmit power.
The 2.4 GHz band travels farther and penetrates walls better, making it the right choice for devices at range or in adjacent rooms — typical readings might be 10–15 dBm stronger than 5 GHz at the same distance. The 5 GHz band offers significantly higher throughput and less congestion in dense neighborhoods but loses signal faster with distance. A good strategy is to connect latency-sensitive or high-bandwidth devices like laptops and streaming boxes to 5 GHz when close to the router, and leave IoT devices and distant gadgets on 2.4 GHz.
netsh wlan show interfaces on Windows) or free apps on mobileFor authoritative networking standards and specifications, refer to the Internet Assigned Numbers Authority (IANA) or IETF RFC documents.
 |
 |
 |
 |

About Tommy N.
Tommy is the founder of RouterHax and a network engineer with over ten years of experience in home and enterprise networking. He has configured and troubleshot networks ranging from simple home setups to multi-site enterprise deployments, with deep hands-on experience in router configuration, WiFi optimization, and network security. At RouterHax, he oversees editorial direction and covers home networking guides, mesh WiFi system reviews, and practical troubleshooting resources for everyday users.
Promotion for FREE Gifts. Moreover, Free Items here. Disable Ad Blocker to get them all.
Once done, hit any button as below
|
|
|
|