by Priya Nakamura Updated Apr 24, 2026
Monitoring bandwidth usage on your router is one of the most effective ways to understand exactly how your internet connection is being consumed — and who or what is eating it up. Whether you're hitting your ISP's data cap, experiencing slow Wi-Fi, or simply curious about which devices are hogging your network, router-level bandwidth monitoring gives you real-time and historical insight that no app on a single device can match.
In this guide you'll learn how router bandwidth monitoring works, how to access and read the traffic data built into most modern routers, and which third-party tools can give you even deeper visibility. Understanding your network's data consumption is closely related to knowing who is on your Wi-Fi and keeping tabs on unauthorized devices — both are essential habits for a well-managed home or small-business network.

Bandwidth monitoring at the router level means measuring the volume of data flowing through your gateway device — the single point through which every byte of internet traffic must pass. Because all traffic crosses the router, it is uniquely positioned to record usage for every connected device simultaneously, something that device-level apps simply cannot do. Most consumer routers capture this data using internal counters that track bytes in and out on the WAN (internet-facing) interface, and many can break that data down per LAN port or per connected wireless client.
The data collected is typically expressed in megabytes (MB) or gigabytes (GB) per day, week, or month, and in real-time as megabits per second (Mbps). Some routers also log packet counts and connection state tables, which are useful for diagnosing unusual traffic patterns that might indicate a compromised device. The key metric most home users care about is total WAN throughput — how much data has entered and exited the router since the last reset period — because that is what counts against an ISP data cap.
Router firmware varies enormously in how much detail it exposes. Budget routers may show only a live speed gauge on the status page, while prosumer firmware like DD-WRT, OpenWrt, or Tomato includes full per-IP traffic accounting, exportable logs, and even SNMP support for feeding data into external dashboards. Manufacturer firmware on modern routers from ASUS (with its Traffic Analyzer feature), Netgear (with Traffic Meter), and TP-Link (with Traffic Statistics) has improved significantly, often providing 30-day rolling graphs without any third-party software.
Understanding bandwidth consumption also feeds directly into other optimization decisions. If you discover that one device is consuming 80% of your upstream capacity, that explains latency spikes for everyone else. Similarly, if your router logs show data transfers occurring at 3 AM when no one is awake, that is a signal worth investigating — it could be a legitimate cloud backup, a scheduled update, or something more concerning.
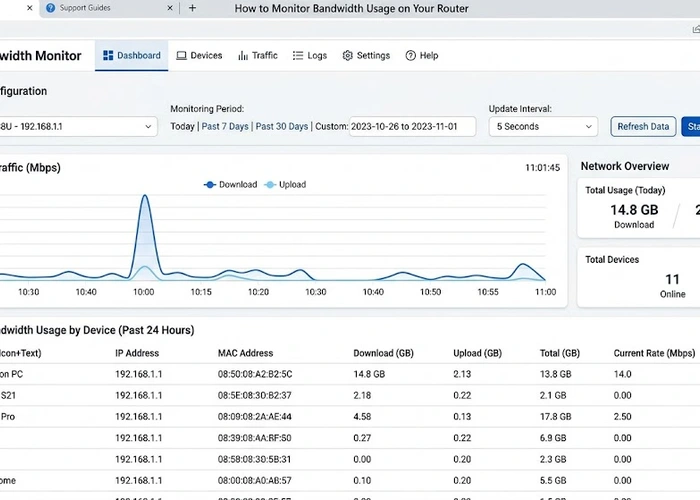
Follow these steps to access and interpret bandwidth data using your router's built-in tools.
Different approaches to router bandwidth monitoring offer different trade-offs between ease of setup, data granularity, and cost. The table below compares the most common options.
| Method | Setup Difficulty | Per-Device Detail | Historical Data | Cost |
|---|---|---|---|---|
| Built-in router firmware (e.g. ASUS Traffic Analyzer) | Easy | Yes (most modern routers) | 30–90 days typical | Free |
| Third-party firmware (DD-WRT / OpenWrt / Tomato) | Moderate — requires flashing | Yes, very detailed | Unlimited with external storage | Free (hardware only) |
| Dedicated hardware monitor (e.g. Fingbox, GL.iNet) | Easy — plug in to LAN | Yes, with app dashboard | Cloud-synced, long-term | $50–$150 hardware |
| SNMP + Grafana / LibreNMS | Hard — requires server setup | Interface-level, very granular | Unlimited | Free (self-hosted) |
| ISP-provided usage portal | None | No (total only) | Current billing cycle | Free (included with service) |
When configuring your router's monthly traffic counter, set the reset date to match the day your ISP billing cycle starts — not the 1st of the month unless that is actually your billing date. This ensures the counter you read aligns with the number your ISP charges against, preventing surprises when you check your bill and find you've already used 90% of your cap with a week to go.
Even with monitoring enabled, there are common pitfalls that lead to inaccurate readings or missed insights. The most frequent issue is counter drift — where the router's internal tally diverges from the ISP's measurement because the router counts traffic at the LAN side (after NAT) or because reboots reset the counter mid-month. Always cross-reference your router's total against your ISP's usage portal at least once a month to verify they agree within a reasonable margin (typically 2–5%).
Another common problem is that VPN traffic tunneled through a device may appear as a single encrypted stream to the router, making it impossible to attribute to a specific application or service. If a device is running a VPN client, its bandwidth entry will still be accurately counted at the router level, but you'll need to check the device itself for application-level detail. This is also worth keeping in mind when you change DNS on your router — DNS-over-HTTPS or encrypted DNS configurations do not hide traffic volume from the router, only the destination names.
For the most reliable long-term monitoring, consider installing OpenWrt on a compatible router and pairing it with nlbwmon or the bwmon package. These store monthly totals across reboots and can export CSV files for spreadsheet analysis. Keeping your firmware current also matters — follow the router firmware update guide to ensure traffic accounting bugs are patched.
Pro Tip: Use the Bandwidth Calculator tool to estimate how long your remaining monthly data will last at your household's average daily usage rate — a useful cross-check when your router reports totals but doesn't project forward to your billing cycle end date.
Log in to your router's admin panel using its local IP address and look for a section labeled Traffic Monitor, Traffic Statistics, or Bandwidth Meter — the exact name depends on your router brand and firmware version. Most routers made after 2018, including popular models from ASUS, Netgear, TP-Link, and Linksys, include at least basic WAN usage counters built in. If you can't find your router's IP, see our guide on how to find your router IP address.
Yes, most modern router firmware provides a per-client traffic breakdown in the bandwidth monitoring section, listing each connected device by IP or MAC address alongside its upload and download totals. On routers running DD-WRT, OpenWrt, or Tomato, this per-IP accounting is especially detailed and can be viewed in real time. Pairing this with your router's DHCP client list lets you match cryptic IP addresses to recognizable device names like "iPhone-Sarah" or "SmartTV-Living-Room."
On mid-range and high-end routers, built-in traffic monitoring has a negligible performance impact because the counters run as lightweight kernel-level processes. On very low-end routers (single-core processors under 600 MHz with less than 64 MB RAM), enabling deep per-IP traffic accounting can consume 5–15% of CPU headroom, which may slightly increase latency under heavy load. If you notice performance degradation after enabling monitoring, try switching to WAN-only totals rather than per-client tracking.
If your router's firmware lacks traffic monitoring, you have several options: flash compatible third-party firmware such as DD-WRT or OpenWrt (check your router model's compatibility first), add a dedicated monitoring device like a Fingbox or GL.iNet router placed between your modem and router, or check your ISP's customer portal, which often shows monthly usage totals even when your router does not. You can also run a software monitor like ntopng on a PC or Raspberry Pi connected to a mirrored switch port, though this requires more technical setup.
Router-side counters are generally accurate to within 1–5% of your ISP's measurement, with differences arising from where in the network stack each party counts bytes (before or after protocol overhead), rounding methods, and whether PPPoE encapsulation headers are included. ISPs measure at their equipment, which is authoritative for billing purposes — so treat your router's counter as a close approximation and always verify against your ISP's portal when nearing a data cap. Small systematic offsets of 2–3% are normal and not a sign of metering fraud.
Yes — many routers with built-in traffic metering (Netgear's Traffic Meter, ASUS's Traffic Analyzer, and most OpenWrt packages) support email or push notifications when usage reaches a defined threshold such as 80% or 90% of a monthly limit. Set your alert threshold a few days before your billing cycle ends so you have time to reduce usage if needed. If your router doesn't support native alerts, third-party services like your ISP's app or a self-hosted Grafana dashboard with alerting rules can fill the gap.
For authoritative networking standards and specifications, refer to the Internet Assigned Numbers Authority (IANA) or IETF RFC documents.
 |
 |
 |
 |

About Priya Nakamura
Priya Nakamura is a telecommunications engineer and networking educator with a Master degree in Computer Networks and a background in ISP infrastructure design and management. Her experience spans both the technical architecture of broadband networks and the practical challenges home users face when configuring routers, managing wireless coverage, and understanding connectivity standards. At RouterHax, she covers WiFi standards and protocols, networking concepts, IP addressing, and network configuration guides.
Promotion for FREE Gifts. Moreover, Free Items here. Disable Ad Blocker to get them all.
Once done, hit any button as below
|
|
|
|